
Resources
-
CAD Models
-
- CAD Model: CGH-S9-C9_A.step
- CAD Model: CGH-S9-C0_A.step
- CAD Model: CGH-S6-C6_A.step
- CAD Model: CGH-S6-C0_A.step
- CAD Model: CGH-S3-C6_A.step
- CAD Model: CGH-S3-C3_A.step
- CAD Model: CGH-S3-C0_A.step
- CAD Model: C6XXXC_A.step
- CAD Model: C4XXXC_A.step
- CAD Model: C3XXXs_A.step
- CAD Model: C2XXXS-BC.step 2-Inch Cylinder CGH
-
-
Documentation
-
- Customer Drawing: MP6-BLANK_A
- Customer Drawing: MP3-BLANK_A
- Customer Drawing: VRT-050_A
- Customer Drawing: CRT-050_A
- Customer Drawing: C6AC3_A
- Customer Drawing: C6R_A
- Customer Drawing: FP9-H600_A
- Customer Drawing: FP6-H600_B
- Customer Drawing: FP6-H425_B
- Customer Drawing: FP3-Z-H600_B
- Customer Drawing: FP3-Z-H425_B
- Customer Drawing: FP3-H600_A
- Customer Drawing: FP3-H425_A
- Customer Drawing: CGH-S9-C9_A
- Customer Drawing: CGH-S9-C0_A
- Customer Drawing: CGH-S6-C6_A
- Customer Drawing: CGH-S6-C0_A
- Customer Drawing: CGH-S3-C6_A
- Customer Drawing: CGH-S3-C3_A
- Customer Drawing: CGH-S3-C0_A
- Customer Drawing: C6XXXC_A
- Customer Drawing: C4XXXC_A
- Customer Drawing: C3XXXS_A
- Customer Drawing: C2XXXS-BC 2-Inch Cylinder CGH
- Customer Drawing: FP6-Z-H650_A
- Show Remaining Articles ( 10 ) Collapse Articles
-
-
- About Morpheus and Installation
- 1. Preparing Metrology Measurements for Morpheus™
- 2. Loading Data into Morpheus™
- 3. Processing the Data in Morpheus™
- 4. Substrate Correction
- 5. Mapping Correction
- 6. Fitting and Removing Alignment Errors
- 7. Analyzing Uncertainty Stack-up
- 8. Generating a Report
- 9. Exporting Data
- 10. Reporting Feedback
- 11. Reporting a Bug
- Glossary
- About
- AOM Software License Agreement
-
-
-
Publications
-
- [2025] Metrology for efficient assembly, integration, and testing of space telescopes
- [2025] Rethinking alignment for systems that incorporate freeform optics
- [2025] Parametric relations for coupling wavefront measurements, mechanical misalignment, and operational performance for imaging systems
- [2025] Kinematic interfaces for freeform optics for efficient manufacture, test, and system assembly
- [2025] Applications of computer generated holograms for measuring X-ray and EUV optics
- [2023] New Applications of Computer Generated Holograms for Optical Testing
- [2023] Rapid surface metrology of freeform shapes using CGH interferometry
- [2022] Snapshot measurements with CGH interferometry to support volume production of freeform optics
- [2022] Computer generated hologram (CGH) education kit for hands-on learning of optical metrology for complex optics and systems
- [2022] CGH-assisted metrology testbed for the Thirty Meter Telescope primary mirror
- [2021] Metrology Testbed for the Thirty Meter Telescope Primary Mirror
- [2019] Interferometric Metrology for the TMT Primary Mirror Segments: Design and Analysis
- [2018] Infrared computer-generated holograms: design and application for the WFIRST grism using wavelength-tuning interferometry
- [2016] Optical Alignment with CGH Phase References
- [2014] Precision Alignment And Calibration Of Optical Systems Using Computer Generated Holograms
- [2014] Diffractive optics calibrator: measurement of etching variations for binary computer-generated holograms
- [2013] Optical testing with computer generated holograms: comprehensive error analysis
- [2013] Design and analysis of an alignment procedure using computer-generated holograms
- [2011] Low uncertainty alignment procedure using computer generated holograms
- [2010] Imaging issues for interferometry with CGH null correctors
- [2010] Measurement of aspheric mirror segments using Fizeau interferometry with CGH correction
- [2009] Fizeau interferometer with spherical reference and CGH correction for measuring large convex aspheres
- [2007] Fabrication error analysis and experimental demonstration for computer-generated holograms
- [2007] Optical alignment with computer-generated holograms
- [2007] Optimal design of computer-generated holograms to minimize sensitivity to fabrication errors
- [2007] Coupling of surface roughness to the performance of computer-generated holograms
- [2006] Analysis of phase sensitivity for binary computer-generated holograms
- [2006] Absolute calibration of null correctors using twin computer-generated holograms
- [2006] Use of computer generated holograms for alignment of complex null correctors
- [2005] Testing an off-axis parabola with a CGH and a spherical mirror as null lens
- [2004] Efficient testing of segmented aspherical mirrors by use of reference plate and computer-generated holograms. I. Theory and system optimization
- [2004] Efficient testing of segmented aspherical mirrors by use of a reference plate and computer-generated holograms. II. Case study, error analysis, and experimental validation
- [1999] Efficient testing of off-axis aspheres with test plates and computer-generated holograms
- [1999] Error analysis for CGH optical testing
- [1999] Diffraction wavefront analysis of computer-generated holograms
- [1995] Applications of computer-generated holograms for interferometric measurement of large aspheric optics
- Show Remaining Articles ( 21 ) Collapse Articles
-
-
FAQs
-
- What is a CGH (Computer-Generated Hologram)?
- How are CGHs used?
- What is a "null"?
- What is a "UUT"?
- How is a CGH mounted and adjusted?
- What types of surfaces can be measured using a CGH?
- What is the typical accuracy of a CGH?
- What are the benefits of using a CGH for metrology?
- What is CGH substrate error and how does it get subtracted?
- What are fiducial dots and how are they used?
- Are CGHs delicate?
- How do you clean a CGH?
- What is a Metrology Platform?
- What type of interferometer do I need to use a CGH?
- What is diffraction efficiency?
- What is the difference between an amplitude and a phase CGH?
- How is a CGH different from other types of holograms?
- What size CGHs does AOM produce?
- Do CGHs require regular calibration?
- How are CGHs made?
- Show Remaining Articles ( 5 ) Collapse Articles
-
-
How-To's
-
- What is a Datum?
- The Importance of UUT Alignment
- [VIDEO] Freeform CGH Metrology Demonstration: Step-by-Step Instructions
- [VIDEO] Metrology Platform for Easy and Precise Alignment in Freeform Optical Testing
- [VIDEO] Aligning a CGH Test
- [VIDEO] How to Measure a Cylinder Optic
- UUT Datum and Optical Coordinate Definitions
- CGH Test Alignment Correction with Morpheus
- [2026] Datum Based Metrology for Freeform Optics
-
Technologies
-
-
- Arc Focus Reference Alignment Patterns (AF)
- Crosshair Point Focus (PF-X)
- Line Focus Reference Alignment Patterns (LF)
- Confocal Point Focus Alignment Pattern (PF-C)
- Catseye Pair Alignment Pattern (CE-P)
- Catseye Single Alignment Pattern (CE-S)
- Collimation Alignment Pattern (CO)
- Visual Point Focus Alignment Pattern (PF-V)
-
-
Overview
The overall summary of a processing run in Morpheus™ is summarized in the Report tool. This tool generates a PDF report for your use, which documents the utilized .cgh file, input measured data, what steps were performed when processing, misalignment details, and the uncertainty summary. The figure below demonstrates what you can expect to see when you create your own report.
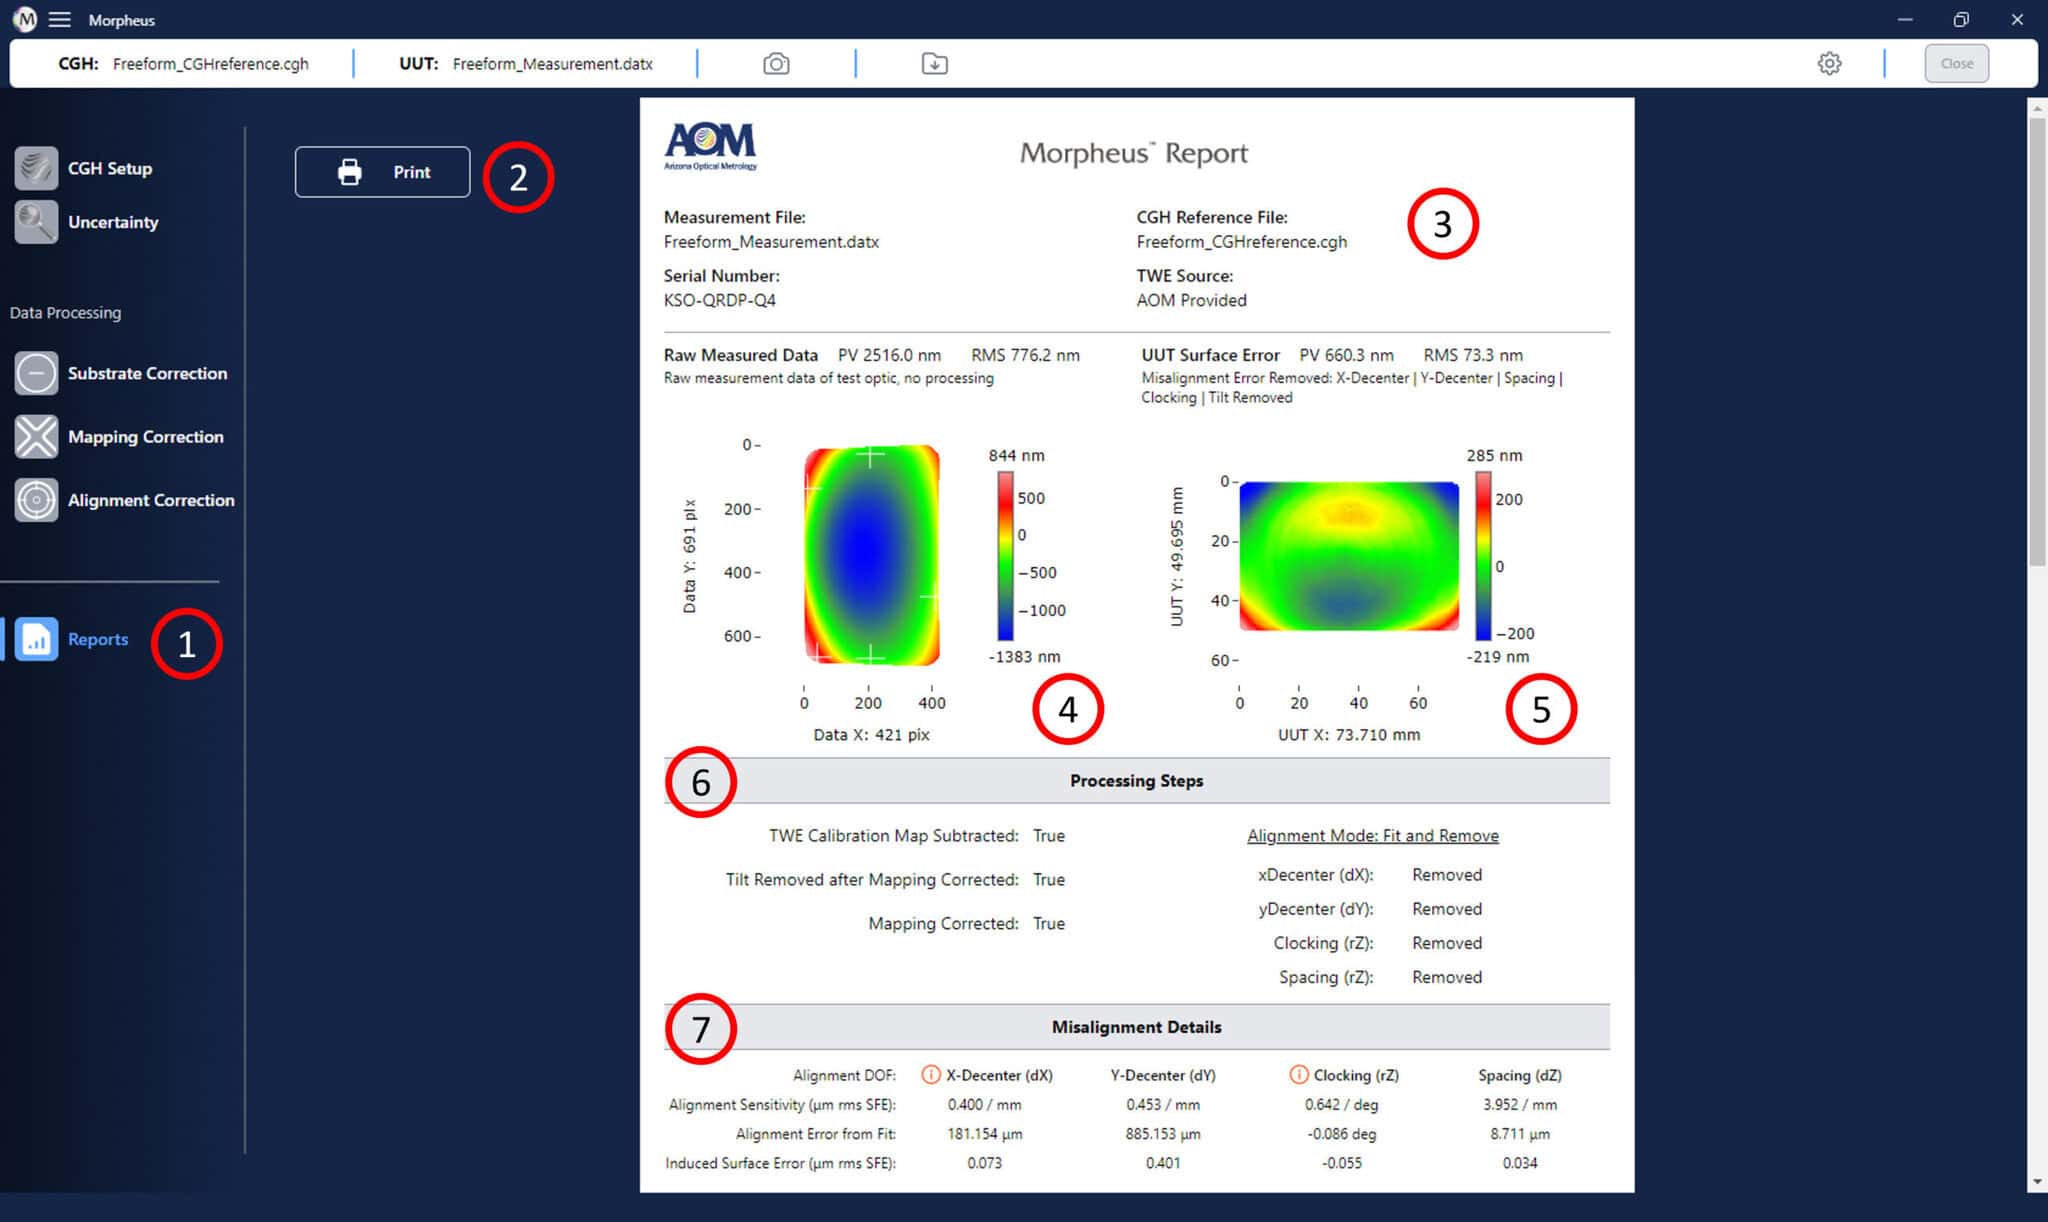
- Click on the Reports” button to view the data report.
- Print the report using the print button, either to a PDF or to a printer.
- The input data information, describing the measurement file, CGH reference file, serial number of the CGH, and TWE source are included at the top of the report.
- The raw measurement data loading into Morpheus™, before any processing in Morpheus™ has occurred, is shown in the upper left of the report.
- The final processed data map, as well as the misalignment data fit and removed (if applicable), is shown in the upper right of the report. This is the data that was saved if and when you clicked the export data button.
- The specific processing steps, and settings applied, during processing by Morpheus™ are reported in the report, as a documentation of exactly what steps occurred to generate the final data.
- The fit misalignment details between the CGH and UUT are reported at the bottom of page 1 of the report.
The second page of the report details the uncertainty information for the processing. The parameters of this page are shown below.
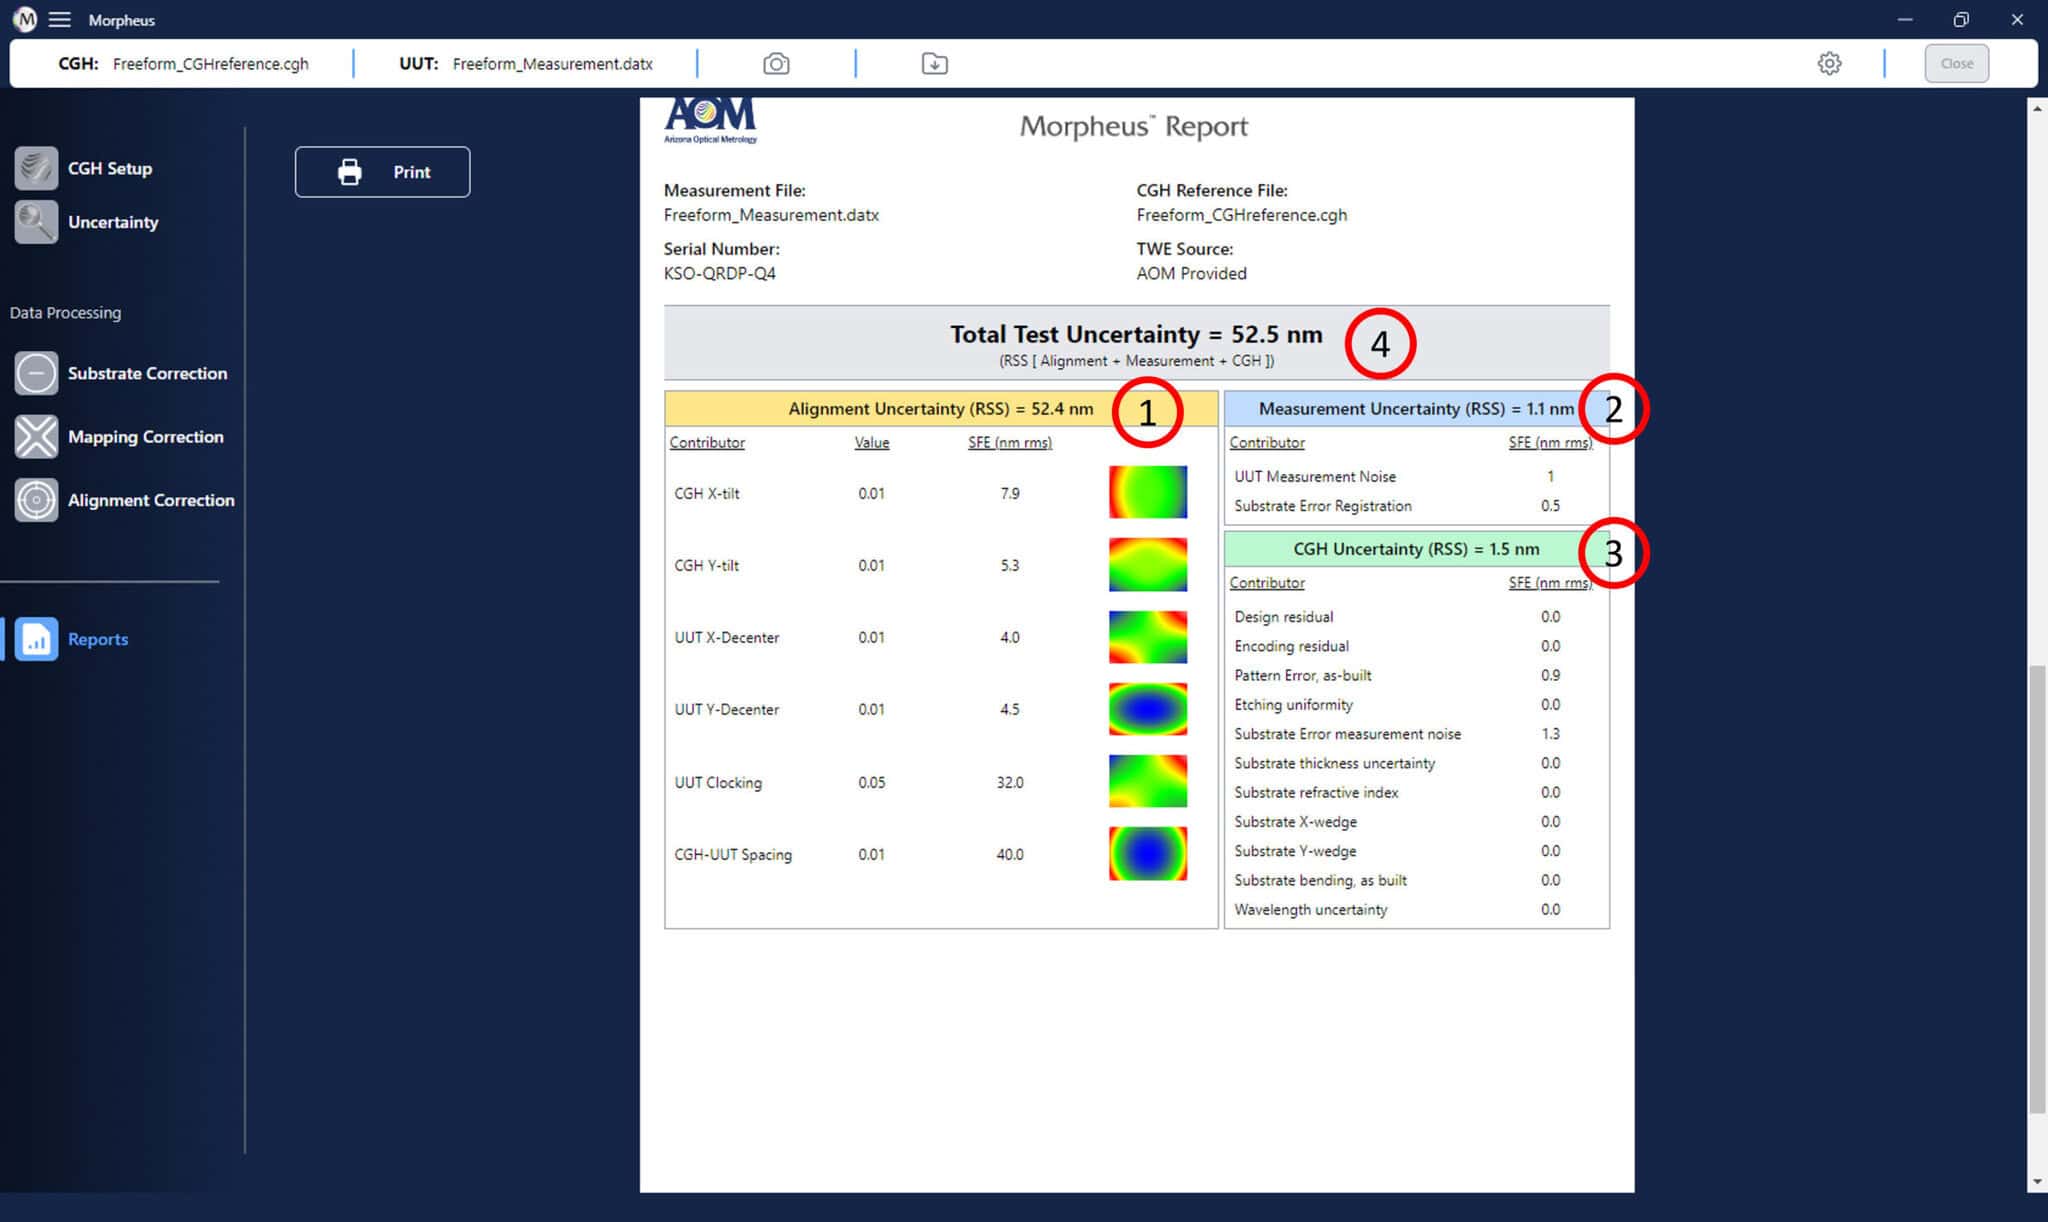
- The alignment uncertainty data is reported in the left of the report, including the individual and total RSS uncertainty.
- The measurement uncertainty is reported in the upper right of the report, detailing the individual and total RSS uncertainty.
- The CGH uncertainty is reported in the lower right of the report, where the as built uncertainty SFE contributions are listed as well as the total RSS uncertainty contribution are listed.
- The total test uncertainty is reported in the top of the page. The total test uncertainty is calculated by combining the individual error sources as a root-sum-square (RSS) stack-up.
Next Steps
At this stage, all processing of data has occurred, and you can now export your data to a file. Please see the Exporting Data section of this manual for details on how to export your data.
Table of Contents