
6. Fitting and Removing Alignment Errors
Overview
The final step in the Morpheus™ data processing pipeline is to identify and optionally remove errors in the UUT measurement data that result from misalignment of the CGH or UUT in the test setup. This step is optional but is recommended to ensure that the measurement data accurately represents the true surface error. Alignment error modes are defined as the unique shape error induced in the metrology measurement when there is decenter in x and y (if applicable), clocking (if applicable), z spacing, and tip and tilt between the UUT and CGH. These alignment degrees of freedom are defined in the UUT coordinate frame, as defined in the Final Design Report provided to you by AOM. Please note, each alignment error mode is defined as the mode + compensation terms from tip and tilt. Thus, these are not pure decenter, clocking, or spacing modes. The alignment error modes are determined during the design of the hologram and are uniquely created for the specific hologram and test geometry matching your UUT when AOM created your CGH. They are unique and specific modal shapes that can be separated from real shape errors in the UUT measurement data. Certain test geometries mean that some alignment error modes are degenerate and thus are not fit to the data (clocking for a rotationally symmetric test optic for example). If you have further questions about the alignment error modes, please contact AOM.
The fit is accomplished by performing a least-squares fit to uniquely identify the amount of each alignment error mode present in the UUT measurement data over a defined aperture region of the test optic aperture ideal surface aperture. This region can be adjusted in the settings menu, so that in scenarios where for example the edge data may not represent accurate alignment data, such as edge roll-off, you can specify to only fit over a reduced aperture region. You have the option then to subtract individual alignment error modes from your data. By default, Morpheus™ subtracts the alignment errors from the UUT data after the fit is complete. Please note that the alignment error modes have a unique signature in your measurement data that makes their removal different from removing traditional surface terms such as Zernikes from your data. We recommend you do not remove any surface terms from your data until after you have removed the alignment error modes.
Viewing Misalignment Mode Fitting and Removal Results
Morpheus™ will automatically fit and remove the alignment error modes from your data and will automatically determine the best combination of alignment error modes to remove to achieve the minimum RMS surface error. Note this may not be correct for your specific data so please review carefully. You can view the results of the fit and removal by clicking on the eyeball button next to the ‘Fit / Remove Alignment Error’ tab in the Data Processing panel of the Morpheus™ window. See below for an example of what the results should look like.
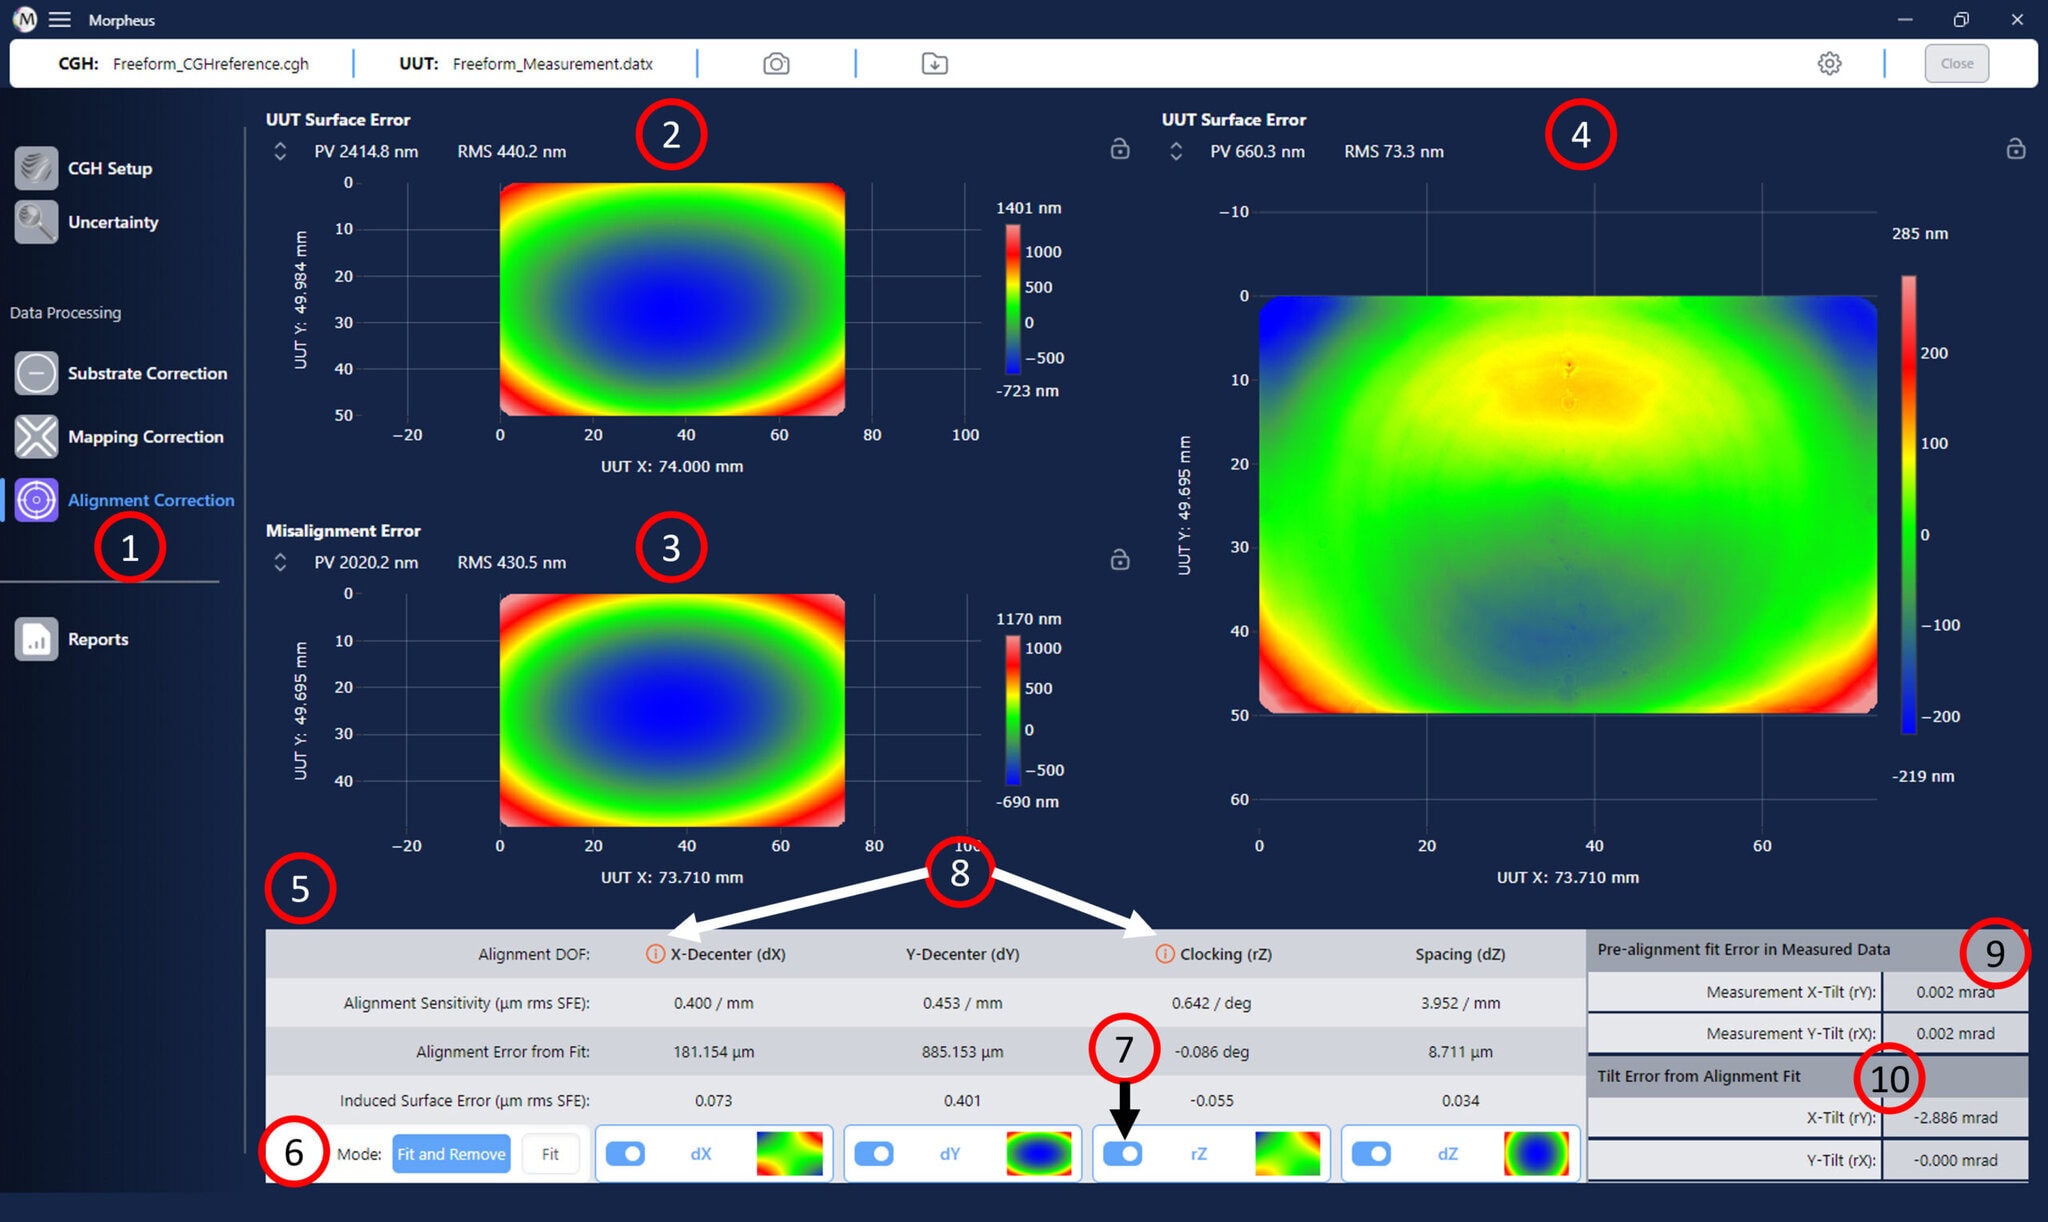
The results of the alignment error analysis are shown in the main window of Morpheus™:
- Click on the “Alignment Correction” button to view the results from this data processing step.
- The input map is shown in the top left panel of the Morpheus™ graphics window. This map has the CGH substrate error removed and has been remapped to UUT coordinates, but no alignment errors have been removed.
- The composite alignment error map is shown in the bottom left panel of the Morpheus™ graphics window. This map is the sum of the individual alignment error modes included in the analysis.
- The difference map, which has any selected alignment error modes removed, is shown in the right panel of the Morpheus™ window. This map represents the final processed data that will be exported from Morpheus™.
- The alignment error table is shown in the panel below the Morpheus™ graphics window.
- The Mode toggle buttons determine if the alignment error modes will be both fit and removed from the input data or only fit to the data.
- The toggle switch next to each alignment degree of freedom determines if that mode will be included in the alignment error analysis.
- Degenerate alignment modes are sometimes possible depending on the CGH and test geometry. When degenerate modes are detected, they are indicated with a warning symbol (8). Only have one degenerate mode active at a time. If multiple are selected, you will get incorrect fitting results.
- Pre-alignment error fit in the mapping corrected map. This represents the inherent tip and tilt that was fit (and, optionally removed if set in settings) in the measurement after mapping correction.
- Tilt error from misalignment fitting. The misalignment modes fit are compensated with tip and tilt to obtain a best null. This tilt error represents the total tip and tilt that arises from the fit misalignment modes. To fully back out all tip and tilt in your part if it were to be at perfect alignment, both this and the pre-alignment error tip and tilt would need to be compensated.
Interpreting and Fitting/Removing Alignment Error Terms
The alignment error table provides all information about the alignment error modes and the ability to select which modes to fit and remove. See below for a detailed look at the alignment error table.
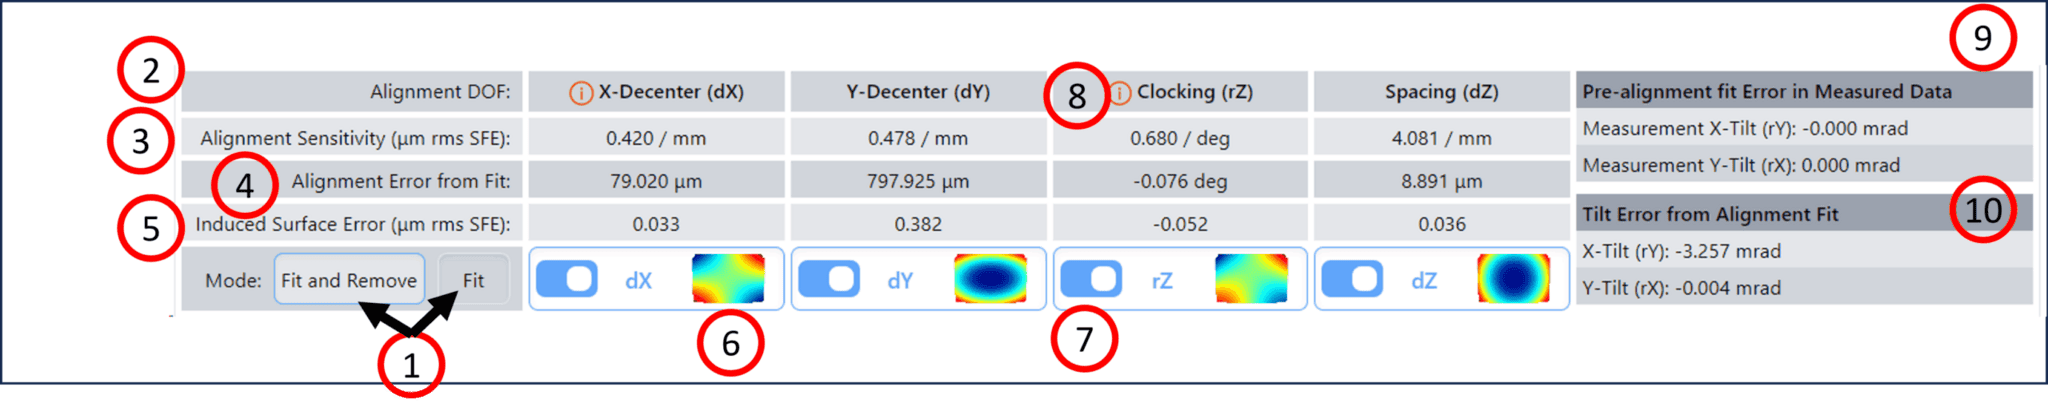
- The Mode toggle buttons determine how the alignment error analysis is applied. If the ‘Fit and Remove’ button is selected, alignment error modes will be removed from your data after fitting. If the ‘Fit’ button is selected, the alignment error modes will only be fit to your data and not subtracted. In either case, the alignment error table contains results from the analysis.
- The alignment degree of freedom (DOF) is shown in the first row.
- The alignment sensitivity for each DOF is shown in the second row. This represents the surface figure error induced in the measurement data per the specified unit of alignment error.
- The alignment error computed from the fit is shown in the fourth row of the table. This indicates how much misalignment for each DOF was detected based on the surface figure errors in your data. This information can be used as feedback to improve your test alignment if desired.
- The induced surface error due to the alignment error for each DOF is shown in the fifth row of the table.
- Maps showing the form of each alignment error mode are shown in the bottom row of the table.
- The toggle switch next to each alignment degree of freedom determines if that mode will be included in the alignment error analysis.
- Degenerate alignment modes are sometimes possible depending on the CGH and test geometry. When degenerate modes are detected, they are indicated with a warning symbol (8). Only have one degenerate mode active at a time. If multiple are selected, you will get incorrect fitting results.
- Lastly, Morpheus lists the pre-alignment fit error in the measured data as well as the tilt error from the alignment fit. The pre-alignment fit error is the inherent tip and tilt present in the measurement after mapping corrected, and represents real tilt in the part during measurement relative to the CGH. It has two components, measurement x-tilt (rY), which represents rotation about the y axis of the part, as defined in the CGH final report, and measurement y-tilt (rX), which represents rotation about the x axis of the part, as defined in the CGH final report.
- The tilt error from alignment fit arises from the fact that the misalignment modes that are fit are compensated with tilt, to represent a real test setup where tilt will typically be actively adjusted out. Thus, when a misalignment is fit, it may have some amount of tilt and or tip. This also has the same two components, x-tilt (rY) and y-tilt (rX). Thus, for the fit misalignment amount, there is also that much tilt about the x and y axis of the part.
Next Steps
At this stage all processing of your data has occurred in Morpheus™. You can now optionally review the uncertainty analysis of your test, which is described in Analyzing Uncertainty Stack-up section of this manual, or you can skip ahead to generating a report of the data processing results, which is described in the Generating a Report section of this manual. If you would simply like to export your data, please see the Exporting Data section of this manual.